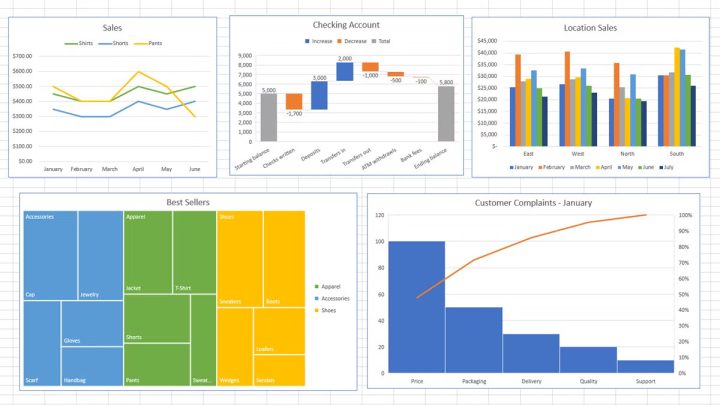
The Power of Conditional Formatting: 7 Creative Ways to Visualize Your Data
If you’ve ever looked at a cluttered spreadsheet and felt overwhelmed, you’re not alone. Data is only useful when it’s easy to interpret—and that’s where conditional formatting in Excel comes in. This powerful feature lets you automatically change the appearance of cells based on their values, helping patterns and insights jump off the page. Whether…


